
Some time ago I wrote a blog about how to configure CloudWatch metrics Spring Boot. It was all before micrometer and depended on Netflix Servo Metrics.
Time was slowly passing and civilizations prospered but it’s still difficult to find info on how to make Spring Boot work with Micrometer CloudWatch.
So here it goes.
TL;DR
If you are not interested in why and just want to make Spring Boot work with AWS CloudWatch do the following:
- add dependencies (build.gradle)
dependencies {
    compile('org.springframework.boot:spring-boot-starter-actuator')
    compile('org.springframework.cloud:spring-cloud-starter-aws')
    compile('io.micrometer:micrometer-registry-cloudwatch:1.0.6')
}
- set required properties
management.metrics.export.cloudwatch.namespace=m3trics2
management.metrics.export.cloudwatch.batchSize=20
That’s it unless you are interested in details - then please continue reading :). You can also check and follow everything in the working code
Micrometer.io and CloudWath Metrics Exporter
It’s not my goal here to describe Mirometer itfself, neither the concept of different metrics - as all the info can be easilly find in micrometer docs.
Setting up Micrometer with Spring Boot is super easy and it’s mostly just adding a specified registry as a dependency, where the registries are different metrics systems that again are listed on micrometer page:
- Atlas
- Datadog
- Ganglia
- Graphite
- Influx
- JMX
- New Relic
- Prometheus
- SignalFx
- StatsD
- Wavefront
Study the list however and you will not find CloudWatch there. Still, the registry exists and can be found both in repo and github waiting to be used.
When making particular metric system (like e.g. datadog) work with Spring boot through micrometer - required components can be found in two places:
-
micrometer-registry-datadog.jar (in case of datadog) - containing Spring Boot independent meter registry and utils
-
spring-boot-actuator-autoconfigure.jar - where we can find autoConfigurations for different systems (like DatadogMetricsExportAutoConfiguration) - automatically creating exporter for metrics system when given registry is present on the classpath.
Situation with CloudWatch however is a little different and we won’t find it’s AutoConfiguration in actuator jar.
The thing is - when creating metrics exporter for CloudWatch we will need Amazon CloudWatch client. With region providers, detecting if app is running in the cloud or not, login profiles, etc - such a client is not a trivial piece to write. Luckilly everything is already written - but not in Spring Boot but in Spring Cloud.
Because it’s Spring Cloud that should depend on Spring Boot, not the other way around - CloudWatchExportAutoConfiguration can’t be put together with other systems in Spring Boot’s actuator. So to use it we need to add one more dependency:
- spring-cloud-aws-autoconfigure.jar
(spring-boot-actuator-autoconfigure.jar is still needed because of classes like StepRegistryProperties)
Properties
Check the CloudWatchExportAutoConfiguration and you will find that the only property needed to enable metrics export to CloudWatch is
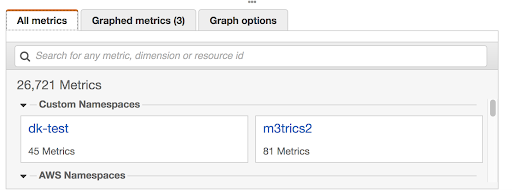
management.metrics.export.cloudwatch.namespace=m3trics2
As name suggests - property names the custom CloudWatch namespace where you will find your metrics.
Because of the bug in Cloud / Micrometer code one more property is needed
management.metrics.export.cloudwatch.batchSize=20
To undersand it you need to know that metrics are sent to CloudWatch asynchronously in batches and Amazon CloudWatch client has a limit of max 20 metrics sent in single batch. CloudWatchConfig handles it corretly, but then actual properties are taken from CloudWatchProperties and this one just takes the batchSize from property or sets default value to 10000 not caring about AWS restriction.
Example metrics
Example code generating metrics can be found here. It’s a super simple web application generating random number every time a particular url is hit (/lucky-number). There is also scheduler hiting this url every 5 seconds to generate demo traffic.
App demonstrates that dozens of metrics are added automatically by Spring Boot - like:
- http.server.requests.avg - how long it took on average in one minute to respond with lucky number,
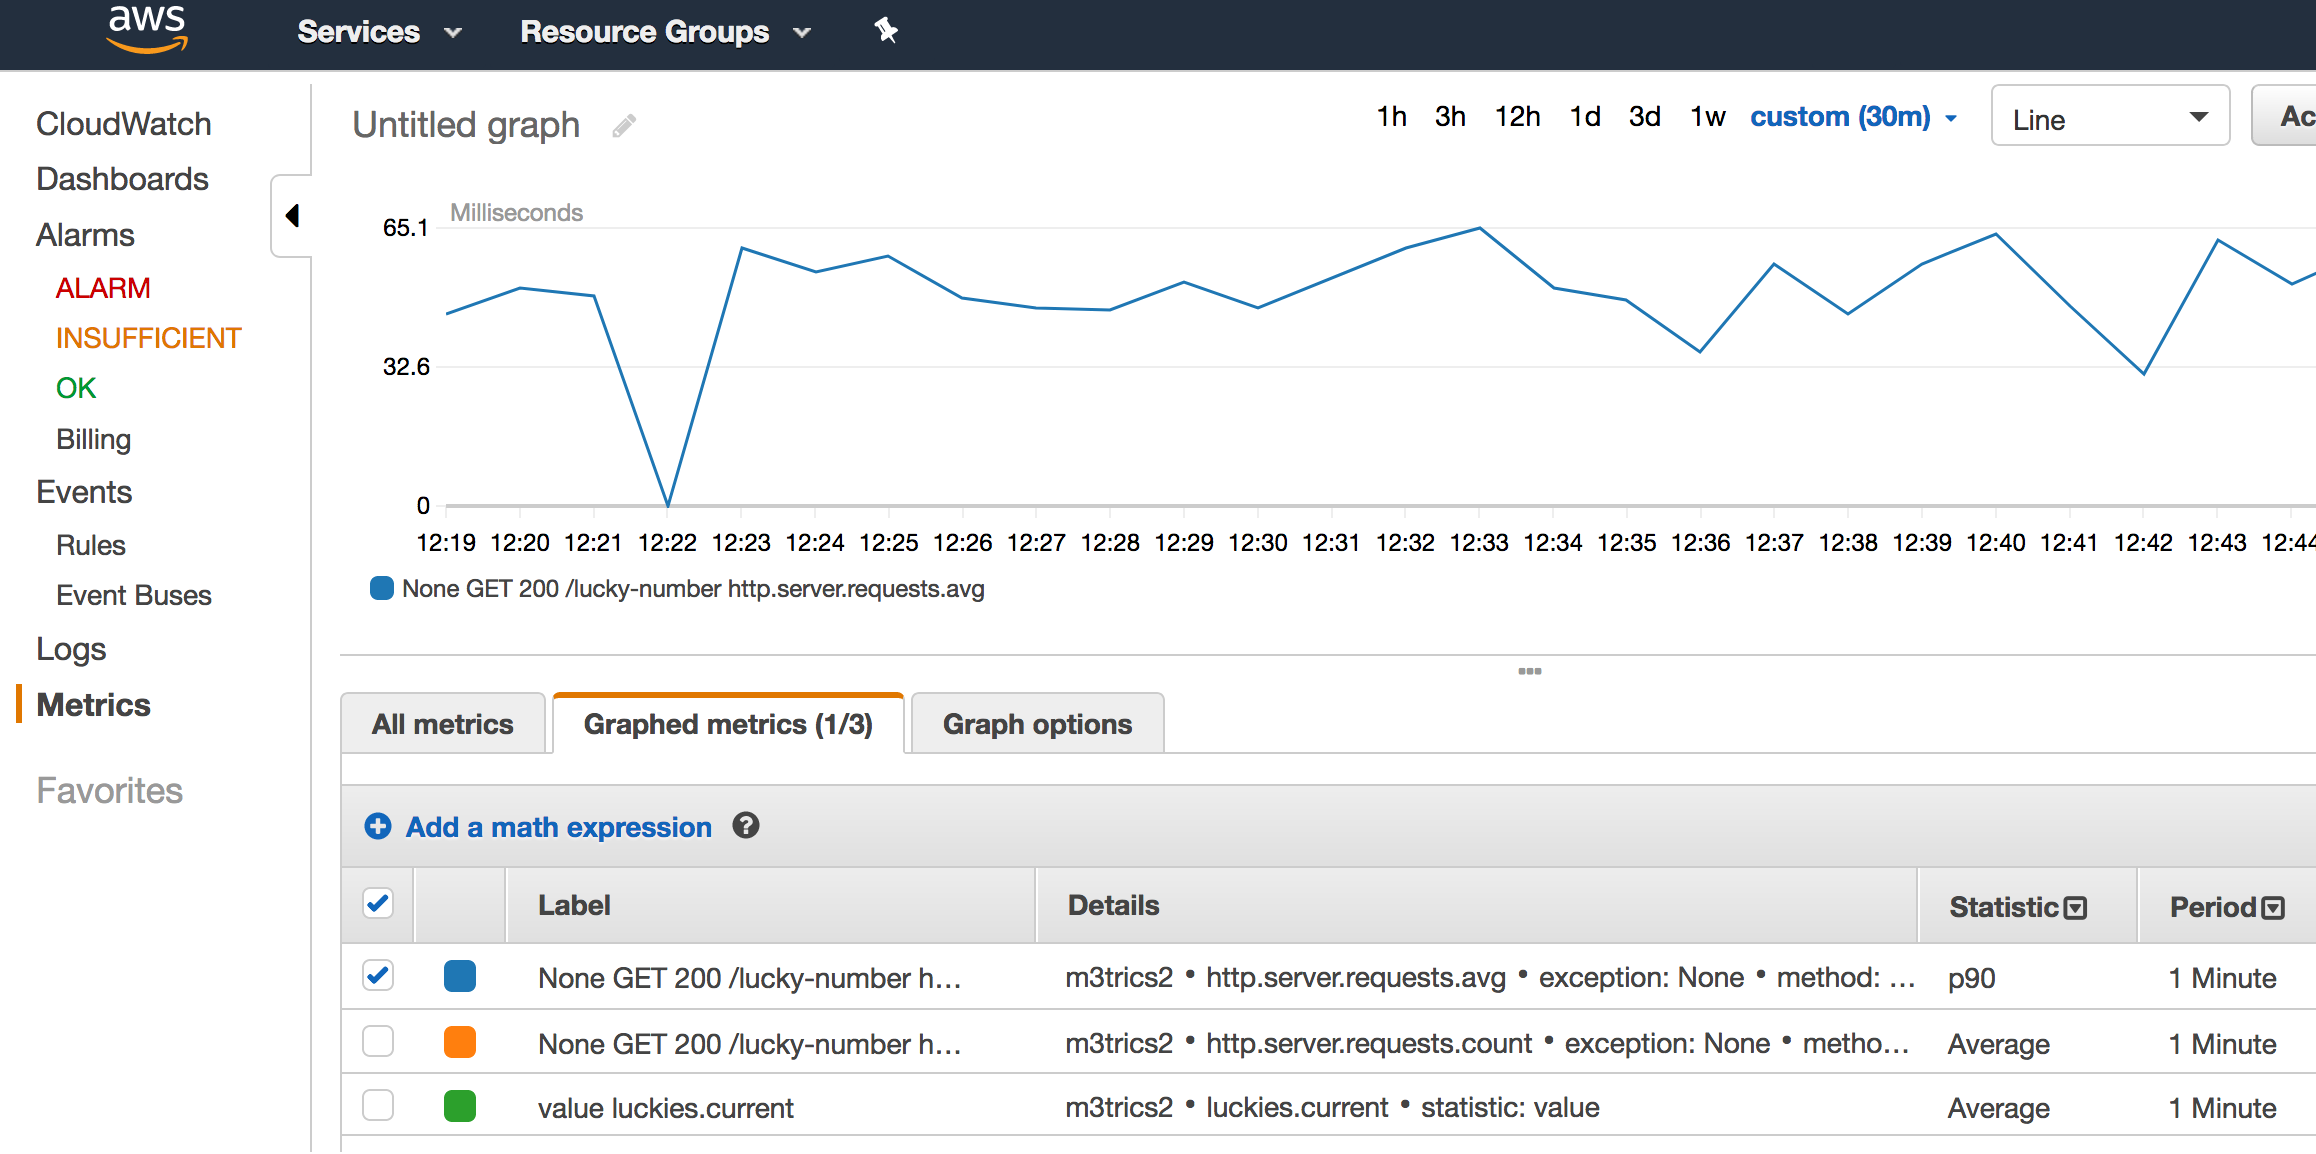
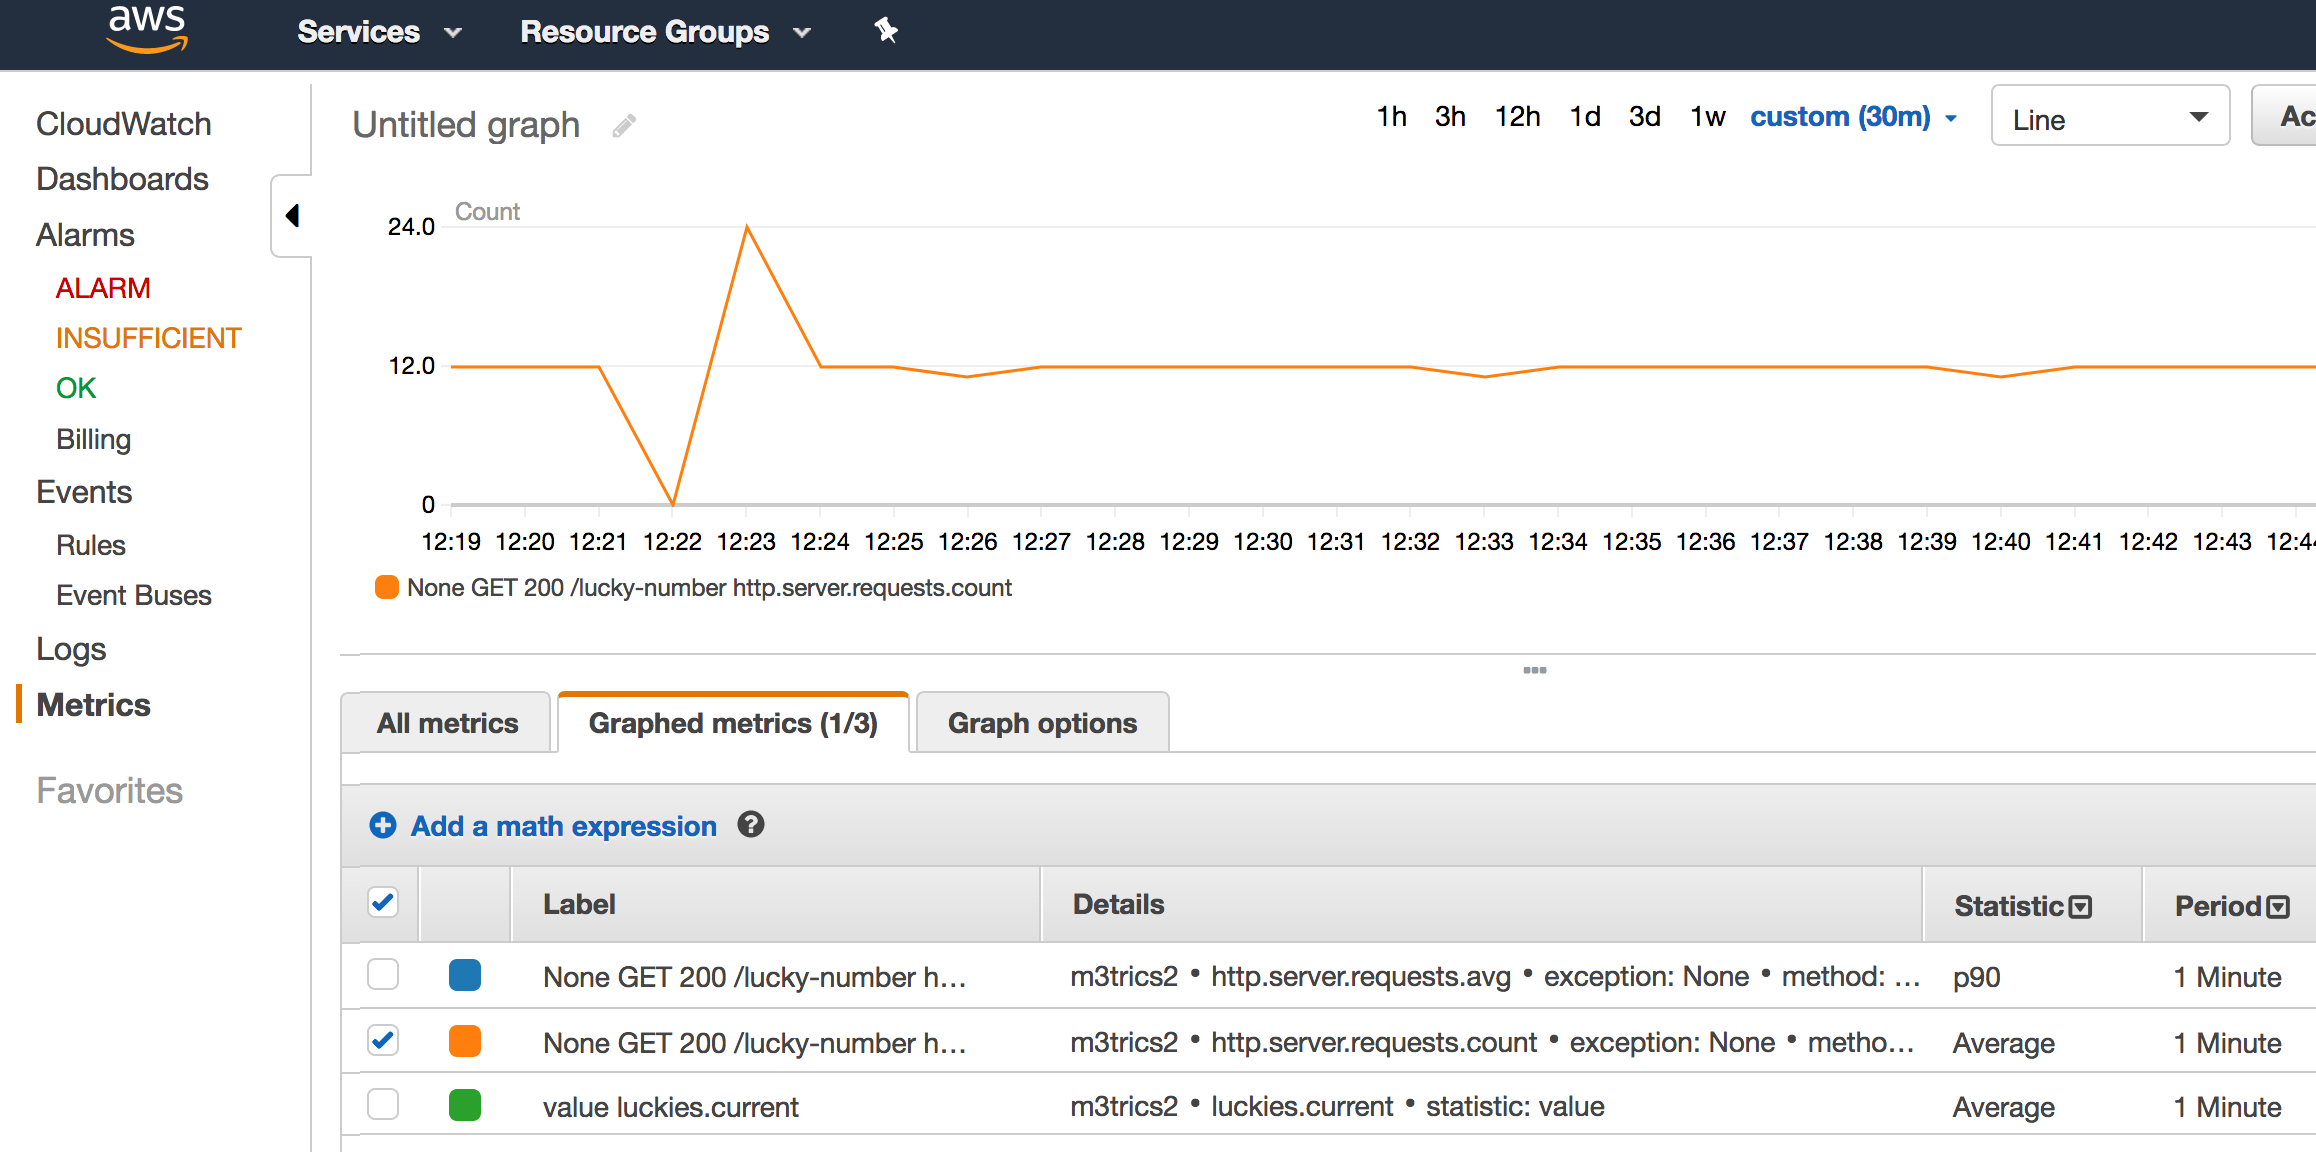
- http.server.requests.count - how many requests where made in one minute
I also added one custom metric - luckies.current (check LuckyNumbersController) which just stores last lucky number that was generated.
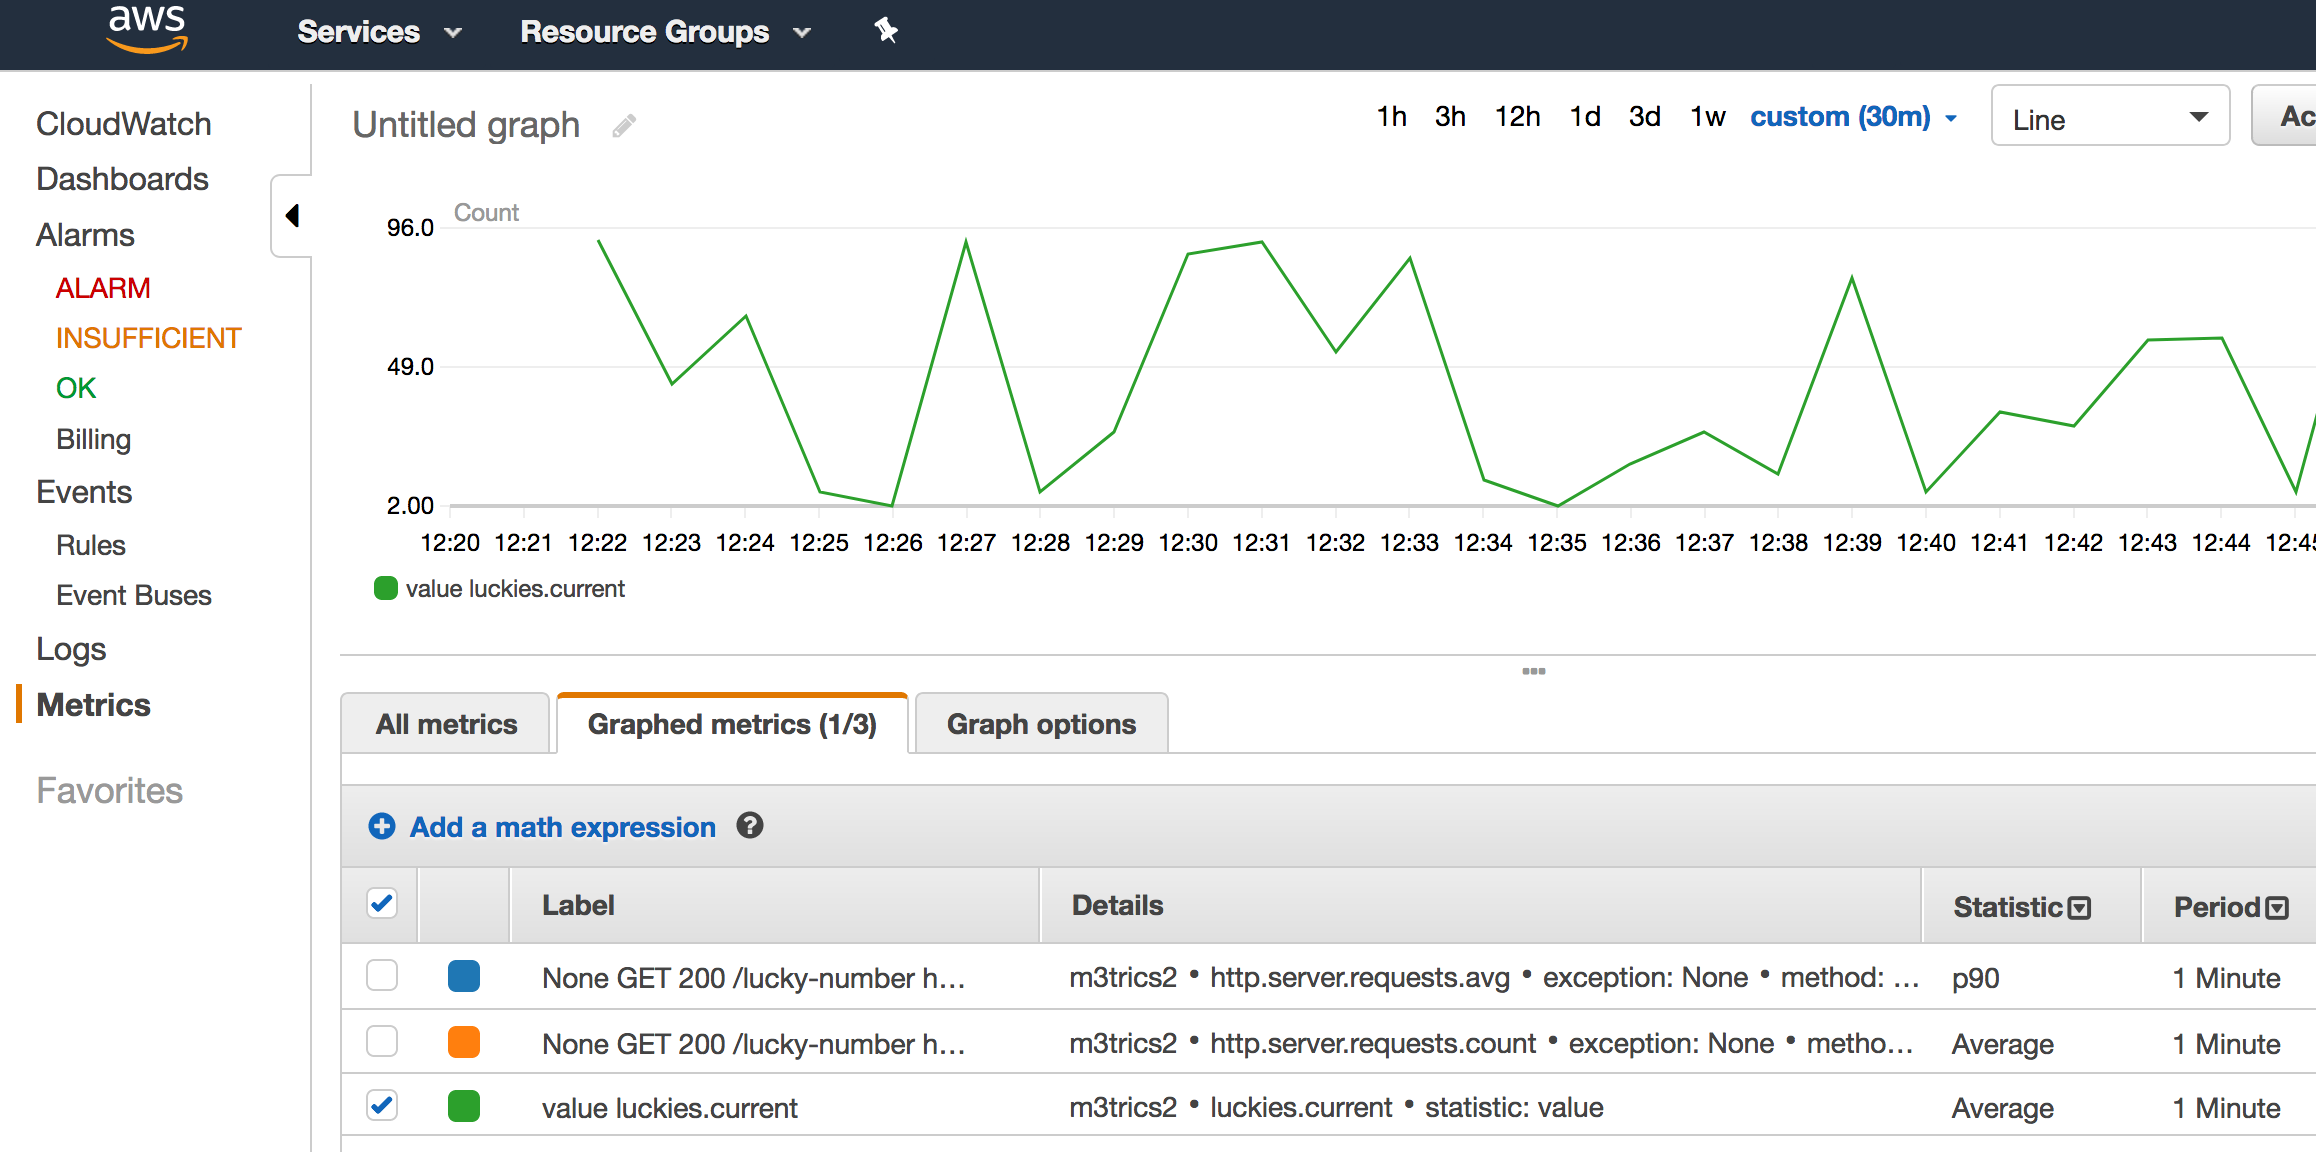
(keep in mind that not all generated numbers will be sent to CloudWatch - as gauge metric used here is probed peridically - details can again be found in micrometer docs)
Again you may check the code here