
Have you ever noticed a lot of default metrics Spring Boot with Micrometer generate for your app? If not - add actuator dependency to your project and hit /actuator/metrics endpoint where you will find useful info about jvm, process, tomcat, traffic and so on. Then add some cache, data sources or jpa dependencies and even more metrics appear. If you ever wondered how they end up there and where can we found explanation about what params do they describe - this is a post for you.
Displaying the Metrics
Just to keep it organized let’s start with how to display the metrics in a Spring Boot app. If you already know it - feel free to skip this section.
Metrics in Spring Boot are handled by micrometer.io, but if you use actuator, there is no need to add micrometer dependency to you project as actuator already depends on it.
And actuator is something you want you use, even if you are not interested in endpoints it provides, as this is the module that registers a lot of the metrics through it’s AutoConfigurations. But more about it later.
So to start - simply add actuator dependency to you project (here to build.gradle.kts)
dependencies {
    implementation("org.springframework.boot:spring-boot-starter-actuator")
}
and to display metric names in actuator endpoint hit http://localhost:8080/actuator/metrics
{
  "names": [
    "jvm.threads.states",
    "process.files.max",
    "jvm.memory.used",
    "jvm.gc.memory.promoted",
    "jvm.memory.max",
    "system.load.average.1m",
    ...
  ]
}
then to see the details - add a metric name to the url path, eg. http://localhost:8080/actuator/metrics/system.cpu.count
{
  "name": "system.cpu.count",
  "description": "The number of processors available to the Java virtual machine",
  "baseUnit": null,
  "measurements": [
    {
      "statistic": "VALUE",
      "value": 8
    }
  ],
  "availableTags": [
  ]
}
These metrics can be regularly sent to a metrics system of your choice (Prometheus, New Relic, CloudWatch, Graphite, etc) by providing specific meter registry. Let’s do it with the simplest registry ever - LoggingMeterRegistry, which simply periodically logs all the metrics.
@Configuration
class MetricsConfig {

    @Bean
    LoggingMeterRegistry loggingMeterRegistry() {
        return new LoggingMeterRegistry();
    }
}
now the metrics are displayed in logs as well:
2019-07-17 11:07:09.406  INFO 91283 --- [trics-publisher] i.m.c.i.logging.LoggingMeterRegistry     : jvm.buffer.count{id=direct} value=0 buffers
2019-07-17 11:07:09.406  INFO 91283 --- [trics-publisher] i.m.c.i.logging.LoggingMeterRegistry     : jvm.buffer.count{id=mapped} value=0 buffers
2019-07-17 11:07:09.406  INFO 91283 --- [trics-publisher] i.m.c.i.logging.LoggingMeterRegistry     : jvm.buffer.memory.used{id=direct} value=0 B
2019-07-17 11:07:09.406  INFO 91283 --- [trics-publisher] i.m.c.i.logging.LoggingMeterRegistry     : jvm.buffer.memory.used{id=mapped} value=0 B
2019-07-17 11:07:09.408  INFO 91283 --- [trics-publisher] i.m.c.i.logging.LoggingMeterRegistry     : jvm.classes.loaded{} value=8530 classes
2019-07-17 11:07:09.408  INFO 91283 --- [trics-publisher] i.m.c.i.logging.LoggingMeterRegistry     : jvm.gc.live.data.size{} value=0 B
2019-07-17 11:07:09.408  INFO 91283 --- [trics-publisher] i.m.c.i.logging.LoggingMeterRegistry     : jvm.gc.max.data.size{} value=0 B
2019-07-17 11:07:09.410  INFO 91283 --- [trics-publisher] i.m.c.i.logging.LoggingMeterRegistry     : jvm.memory.committed{area=nonheap,id=Compressed Class Space} value=6.25 MiB
2019-07-17 11:07:09.410  INFO 91283 --- [trics-publisher] i.m.c.i.logging.LoggingMeterRegistry     : jvm.memory.committed{area=heap,id=G1 Eden Space} value=168 MiB
...
Metrics Supply
So how these metrics are being provided?
One example might be WebMvcMetricsFilter adding performance metrics to all your Spring WebMvc endpoints (http.server.requests metric).
But this case is easy. When all your requests are handled by Spring framework it’s no brainer to add a call generating metrics inside (just check the WebMvcMetricsFilter.record() method).
But what about cases when you use pure ehcache or hibernate or some data source and metrics are generated anyway?
What about cache.* metrics which are generated even if I @Autowired pure net.sf.ehcache.Cache?
What about hibernate.* metrics which are generated even if I @Autowired pure org.hibernate.SessionFactory?
And then - how the jvm.*, process.*, tomcat.*, etc are being generated?
It appears it’s simpler than one might think, as the these statistics are provided by monitored components themselves.
Sometimes it will be provided directly, like with
cache.getStatistics() providing StatisticsGateway for EhCache
or
sessionFactory.getStatistics() providing Statistics for Hibernate SessionFactory, and so on.
And sometimes by some other mean, like managed beans, e.g.
RuntimeMXBean for jvm process.* metrics,
Tomcat mbeans (like GlobalRequestProcessor, Servlet, etc) for tomcat.* metrics
To access these statistics and translate them to specific metrics, Micrometer introduces the concept of a MeterBinder.
Check MeterBinder impelementation hierarchy and you will know what groups of metrics are avaiable.
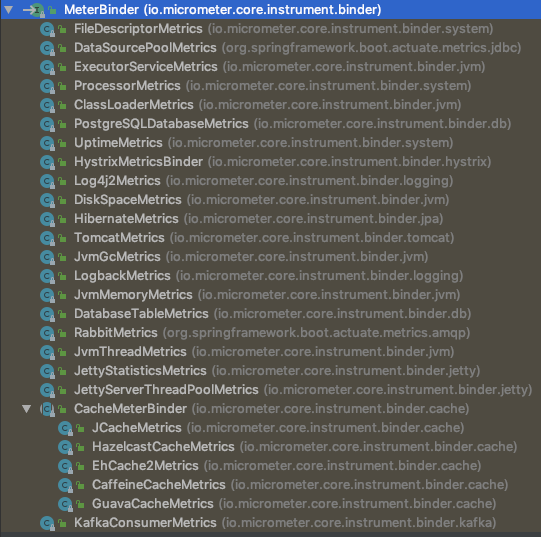
You can also check it directly in micrometer repo.
Open for example EhCache2Metrics, and you will find what and how Ehcache statistics are mapped to specific Micrometer metrics
cache.size -> StatisticsGateway:getSize
cache.gets{result=miss} -> StatisticsGateway:cacheMissCount
cache.gets{result=hit} -> StatisticsGateway:cacheHitCount
cache.puts -> StatisticsGateway:cachePutCount
cache.evictions -> StatisticsGateway:cacheEvictedCount
cache.remoteSize -> StatisticsGateway::getRemoteSize
cache.removals -> StatisticsGateway::cacheRemoveCount
cache.puts.added{result=added} -> StatisticsGateway::cachePutAddedCount
cache.puts.added{result=updated} -> StatisticsGateway::cachePutAddedCount
cache.misses{reason=expired} -> StatisticsGateway::cacheMissExpiredCount)
cache.misses{reason=notFound} -> StatisticsGateway::cacheMissNotFoundCount)
cache.xa.commits{result=readOnly} -> StatisticsGateway::xaCommitReadOnlyCount
cache.xa.commits{result=exception} -> StatisticsGateway::xaCommitExceptionCount
cache.xa.commits{result=committed} -> StatisticsGateway::xaCommitCommittedCount
cache.xa.rollbacks{result=exception} -> StatisticsGateway::xaRollbackExceptionCount
cache.xa.rollbacks{result=success} -> StatisticsGateway::xaRollbackSuccessCount
cache.xa.recoveries{result=nothing} -> StatisticsGateway::xaRecoveryNothingCount
cache.xa.recoveries{result=success} -> StatisticsGateway::xaRecoveryRecoveredCount
cache.local.offheap.size -> StatisticsGateway::getLocalOffHeapSize)
cache.local.heap.size -> StatisticsGateway::getLocalHeapSizeInBytes
cache.local.disk.size -> StatisticsGateway::getLocalDiskSizeInBytes
Registering MeterBinders is extremely easy, and examples can be found in the micrometer documentation.
So you can do it manually
new ClassLoaderMetrics().bindTo(registry);
new JvmMemoryMetrics().bindTo(registry);
new EhCache2Metrics(cache, Tags.of("name", cache.getName())).bindTo(registry)
new TomcatMetrics(manager, tags).bindTo(registry)
...
Or use String Boot which will do it for you under the hood.
Mentioned before actuator will provide many AutoConfigurations and MetricsBinders that will register MeterBinders whenever given dependency is added. eg.
TomcatMetricsBinder will register TomcatMetrics (for your embedded container)
MeterRegistryConfigurer will register Jvm, Uptime and other system metrics.
Now - let’s say you want to use Ehcache in your app.
Add two dependecies
    implementation("org.springframework.boot:spring-boot-starter-cache")
    implementation("net.sf.ehcache:ehcache")
then register the cache (you can also do it by ehcache.xml)
    @Bean
    Cache playCache(EhCacheCacheManager cacheManager) {
        CacheConfiguration cacheConfiguration = new CacheConfiguration()
            .name(CACHE_NAME)
            .maxEntriesLocalHeap(MAX_ELEMENTS_IN_MEMORY);
        Cache cache = new Cache(cacheConfiguration);
        cacheManager.getCacheManager().addCache(cache);
        cacheManager.initializeCaches();
        return cache;
    }
now CacheMetricsRegistrarConfiguration will register EhCache2Metrics for every cache managed by Spring Cache Managers.
If you don’t want to use Spring cache managers - you can also register EhCache2Metrics by yourself.
Now launch the app and you will see additional Ehcache metrics.
2019-07-17 13:08:45.113  INFO 93052 --- [trics-publisher] i.m.c.i.logging.LoggingMeterRegistry     : cache.gets{cache=playCache,cacheManager=cacheManager,name=playCache,result=hit} throughput=12.95/s
2019-07-17 13:08:45.124  INFO 93052 --- [       Thread-4] i.m.c.i.logging.LoggingMeterRegistry     : cache.misses{cache=playCache,cacheManager=cacheManager,name=playCache,reason=notFound} throughput=3.7/s
2019-07-17 13:08:45.124  INFO 93052 --- [trics-publisher] i.m.c.i.logging.LoggingMeterRegistry     : cache.gets{cache=playCache,cacheManager=cacheManager,name=playCache,result=miss} throughput=3.7/s
2019-07-17 13:08:48.840  INFO 93052 --- [       Thread-4] i.m.c.i.logging.LoggingMeterRegistry     : cache.puts{cache=playCache,cacheManager=cacheManager,name=playCache} throughput=16.65/s
2019-07-17 13:08:48.840  INFO 93052 --- [trics-publisher] i.m.c.i.logging.LoggingMeterRegistry     : cache.misses{cache=playCache,cacheManager=cacheManager,name=playCache,reason=notFound} throughput=3.7/s
2019-07-17 13:08:48.841  INFO 93052 --- [trics-publisher] i.m.c.i.logging.LoggingMeterRegistry     : cache.puts{cache=playCache,cacheManager=cacheManager,name=playCache} throughput=16.65/s
2019-07-17 13:08:48.841  INFO 93052 --- [       Thread-4] i.m.c.i.logging.LoggingMeterRegistry     : cache.puts.added{cache=playCache,cacheManager=cacheManager,name=playCache,result=updated} throughput=0.116667/s
2019-07-17 13:08:48.841  INFO 93052 --- [trics-publisher] i.m.c.i.logging.LoggingMeterRegistry     : cache.puts.added{cache=playCache,cacheManager=cacheManager,name=playCache,result=updated} throughput=0.116667/s
2019-07-17 13:08:48.841  INFO 93052 --- [       Thread-4] i.m.c.i.logging.LoggingMeterRegistry     : cache.puts.added{cache=playCache,cacheManager=cacheManager,name=playCache,result=added} throughput=0.116667/s
2019-07-17 13:08:48.842  INFO 93052 --- [trics-publisher] i.m.c.i.logging.LoggingMeterRegistry     : cache.puts.added{cache=playCache,cacheManager=cacheManager,name=playCache,result=added} throughput=0.116667/s
2019-07-17 13:08:48.847  INFO 93052 --- [trics-publisher] i.m.c.i.logging.LoggingMeterRegistry     : cache.local.disk.size{cache=playCache,cacheManager=cacheManager,name=playCache} value=0 B
2019-07-17 13:08:48.847  INFO 93052 --- [       Thread-4] i.m.c.i.logging.LoggingMeterRegistry     : cache.local.disk.size{cache=playCache,cacheManager=cacheManager,name=playCache} value=0 B
2019-07-17 13:08:48.908  INFO 93052 --- [       Thread-4] i.m.c.i.logging.LoggingMeterRegistry     : cache.local.heap.size{cache=playCache,cacheManager=cacheManager,name=playCache} value=1.039062 KiB
2019-07-17 13:08:48.908  INFO 93052 --- [trics-publisher] i.m.c.i.logging.LoggingMeterRegistry     : cache.local.heap.size{cache=playCache,cacheManager=cacheManager,name=playCache} value=1.039062 KiB
2019-07-17 13:08:48.909  INFO 93052 --- [trics-publisher] i.m.c.i.logging.LoggingMeterRegistry     : cache.local.offheap.size{cache=playCache,cacheManager=cacheManager,name=playCache} value=0 B
2019-07-17 13:08:48.909  INFO 93052 --- [       Thread-4] i.m.c.i.logging.LoggingMeterRegistry     : cache.local.offheap.size{cache=playCache,cacheManager=cacheManager,name=playCache} value=0 B
2019-07-17 13:08:48.909  INFO 93052 --- [       Thread-4] i.m.c.i.logging.LoggingMeterRegistry     : cache.remoteSize{} value=0
2019-07-17 13:08:48.909  INFO 93052 --- [trics-publisher] i.m.c.i.logging.LoggingMeterRegistry     : cache.remoteSize{} value=0
2019-07-17 13:08:48.909  INFO 93052 --- [       Thread-4] i.m.c.i.logging.LoggingMeterRegistry     : cache.size{cache=playCache,cacheManager=cacheManager,name=playCache} value=7
2019-07-17 13:08:48.909  INFO 93052 --- [trics-publisher] i.m.c.i.logging.LoggingMeterRegistry     : cache.size{cache=playCache,cacheManager=cacheManager,name=playCache} value=7
In this case, responsibility of each component in context of metrics can be summarized as:
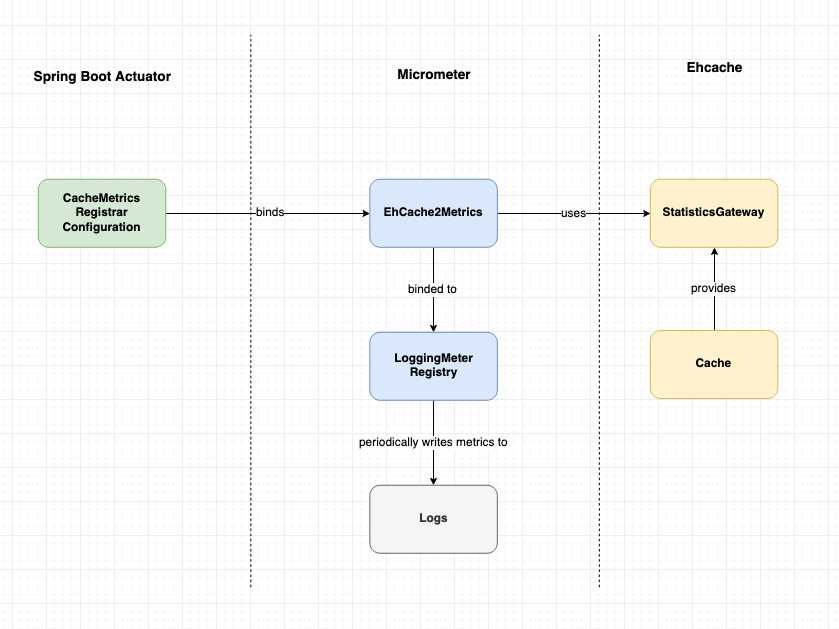
You ma check all these concepts in an example app provided here.